Embark on an enlightening journey with K6 for Performance Test, the definitive guide to maximizing application performance. Delve into the realm of performance testing, unlocking the secrets to building robust and efficient systems that meet the demands of modern users.
Through this comprehensive exploration, we will unravel the capabilities of K6, empowering you to identify performance bottlenecks, optimize resource utilization, and ensure seamless user experiences. Prepare to elevate your testing prowess and push the boundaries of performance excellence.
K6 Introduction
K6 is an open-source load testing tool designed for performance testing web applications, APIs, and microservices. It is written in Go and provides a powerful scripting language for creating realistic user scenarios.
K6 offers several benefits for performance testing, including:
– High performance: K6 can generate a large number of concurrent virtual users (VUs) to simulate realistic load conditions.
– Scalability: K6 can be easily scaled up or down to meet the needs of your testing scenario.
– Extensibility: K6 can be extended with custom scripts to meet the specific requirements of your application.
K6 Installation and Setup
K6 is an open-source load testing tool used to evaluate the performance of web applications and APIs. Installing and setting up K6 is straightforward and can be done on various operating systems.
Before installing K6, ensure you have the following prerequisites:
- Node.js version 10 or later
- A text editor or IDE
Installation on Different Operating Systems
To install K6 on different operating systems, follow these steps:
- Windows: Use the Chocolatey package manager:
choco install k6 - macOS: Use Homebrew:
brew install k6 - Linux: Use the package manager for your distribution (e.g.,
apt-get install k6for Debian/Ubuntu)
Running K6 Tests
Once installed, you can run K6 tests in various ways:
- Locally: Run K6 tests directly from your local machine using the command:
k6 run script.js - In the Cloud: Use a cloud-based service like Load Impact or BlazeMeter to run K6 tests on a larger scale.
- Using Docker: Use the official K6 Docker image to run tests in a containerized environment:
docker run loadimpact/k6
K6 Test Scripts
K6 test scripts are written in JavaScript and follow a specific syntax. Here’s an example of a simple K6 script:
import http from 'k6/http';

export default function()
  http.get('https://example.com');
K6 Scripting Language
K6 provides a powerful and versatile scripting language specifically designed for performance testing. It enables users to create robust and expressive scripts that accurately simulate real-world user behavior and capture detailed performance metrics.
K6 scripts are written in JavaScript and leverage the ECMAScript 6 (ES6) standard. This modern language offers a comprehensive set of features, including support for asynchronous programming, object-oriented design, and functional programming techniques.
Script Structure
K6 scripts typically follow a modular structure, consisting of multiple modules that are combined to create a complete test scenario. Each module serves a specific purpose, such as defining test options, setting up data, executing test cases, or reporting results.
- Options Module: Configures test settings, such as the number of virtual users, test duration, and performance metrics to be tracked.
- Data Module: Loads and manages test data, including user profiles, input parameters, and expected outcomes.
- Test Case Module: Defines the sequence of actions that virtual users will perform during the test, including HTTP requests, API calls, and other interactions.
- Reporting Module: Generates and exports performance reports in various formats, such as HTML, JSON, and CSV.
Asynchronous Programming
K6 scripts heavily utilize asynchronous programming techniques, which allow for non-blocking I/O operations. This approach enables scripts to execute multiple tasks concurrently, maximizing resource utilization and improving test performance.
K6 leverages the JavaScript Promise API to handle asynchronous operations, providing a structured and efficient way to manage concurrent tasks.
Remember to click QA Fundamental to understand more comprehensive aspects of the QA Fundamental topic.
Declarative Syntax
K6 scripts are written in a declarative style, emphasizing the specification of test behavior rather than the implementation details. This approach simplifies script development and maintenance, making it easier to create complex test scenarios with minimal code.
K6 Performance Metrics
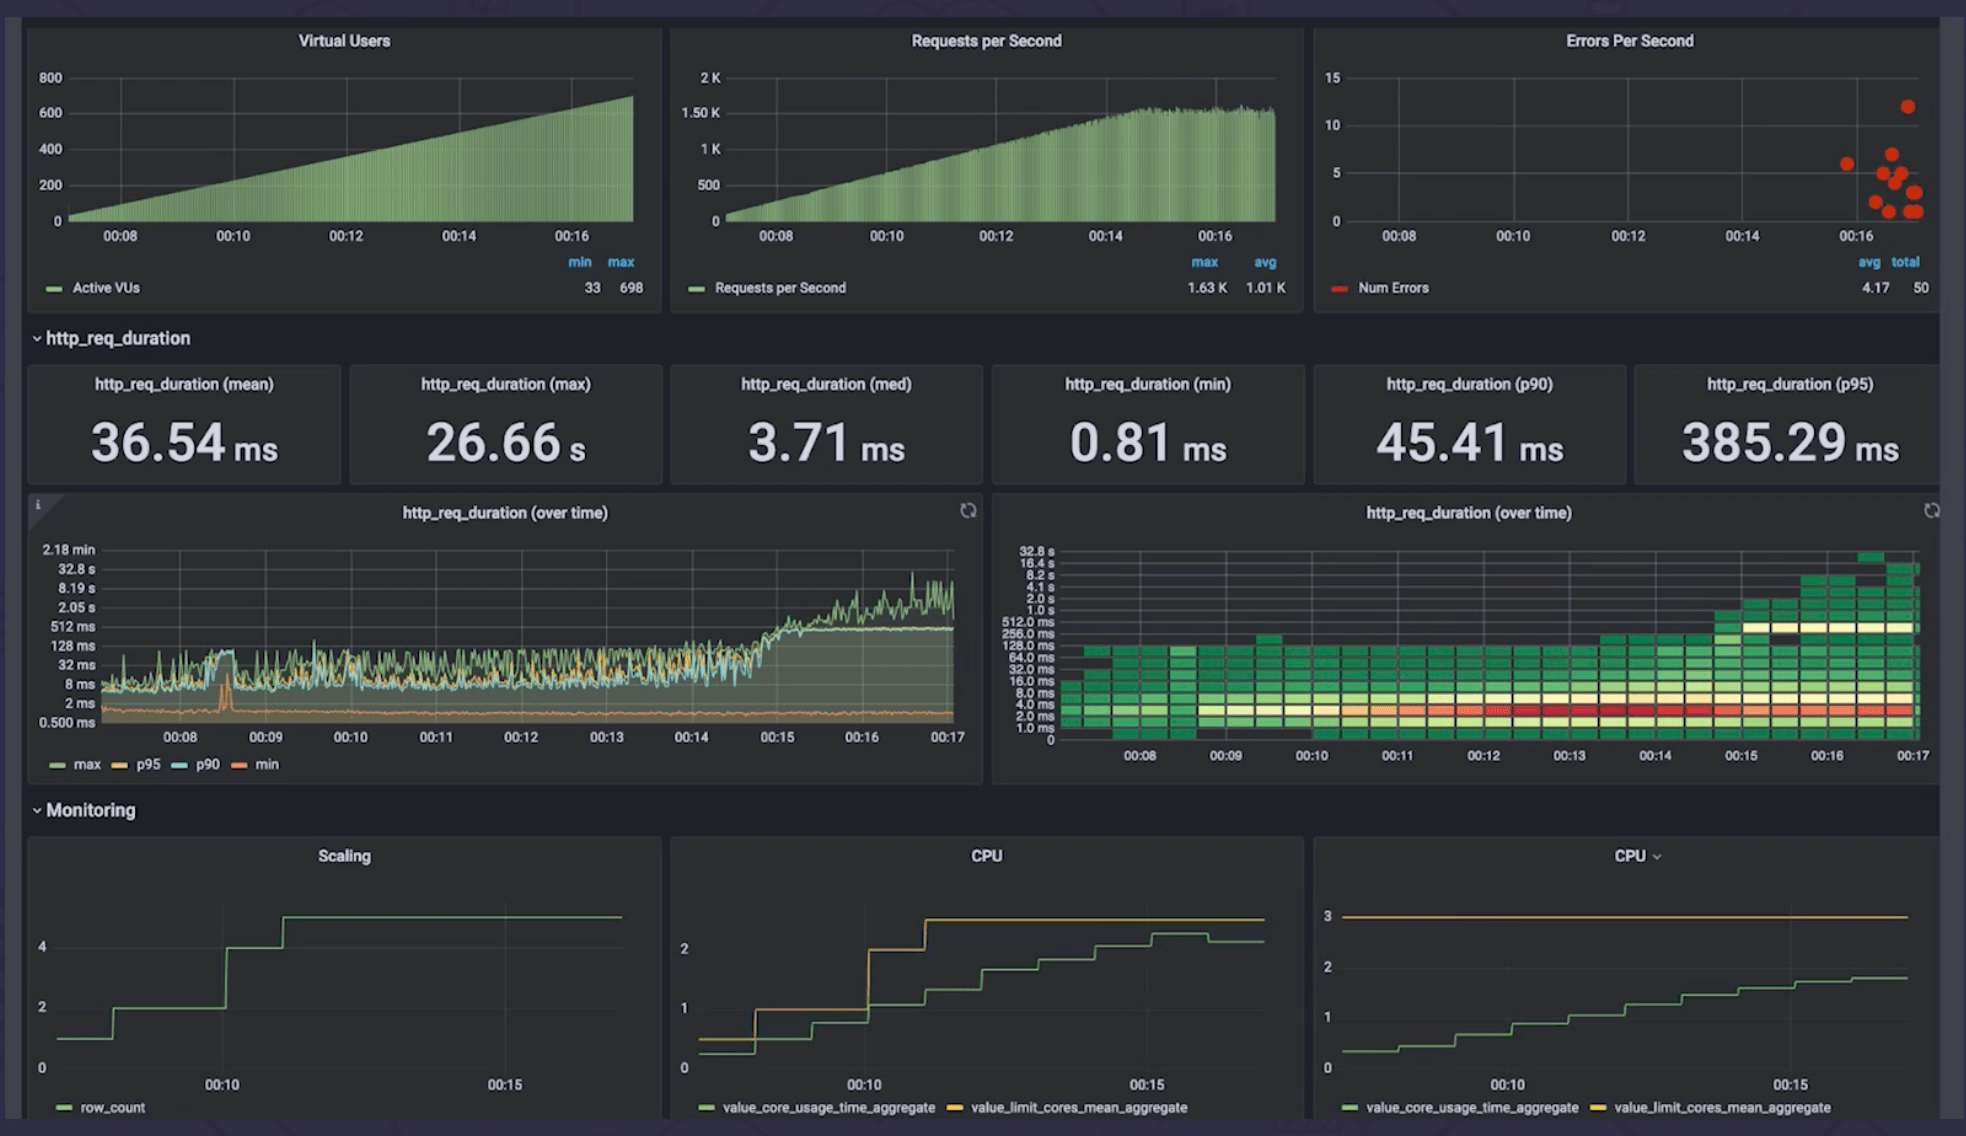
K6 provides a comprehensive set of performance metrics that can help you understand the behavior of your application under load. These metrics include:
- Requests per second (RPS)
- Response time
- Error rate
- Throughput
- Memory usage
- CPU usage
These metrics can be used to identify bottlenecks in your application and to track performance improvements over time.
Interpreting K6 Performance Results
When interpreting K6 performance results, it is important to consider the following factors:
- The load that was applied to the application
- The duration of the test
- The type of application being tested
It is also important to compare the results of your K6 tests to your performance goals. This will help you to determine if your application is meeting your expectations.
– Provide a step-by-step guide on how to set up and run a K6 load test.
Setting up and running a K6 load test involves several steps:
- Install K6: Install K6 using the appropriate package manager for your operating system.
- Create a K6 script: Write a K6 script to define the test scenario and specify the target URL.
- Run the load test: Execute the K6 script using the `k6 run` command.
- Monitor the test results: Observe the test results in real-time using the K6 dashboard or by analyzing the generated report.
- Analyze the results: Examine the performance metrics and identify any bottlenecks or areas for improvement.
K6 Stress Testing
K6 stress testing helps determine the limits of your system by simulating extreme load conditions. It enables you to identify performance bottlenecks and ensure your system can withstand high levels of concurrency and traffic.
With K6, you can perform various types of stress tests, including:
Load Testing
Simulates realistic user traffic patterns to assess system performance under expected peak load conditions.
Spike Testing
Introduces sudden bursts of traffic to evaluate system behavior during unexpected surges in user activity.
Soak Testing
Sustains a high level of load over an extended period to uncover performance degradation or memory leaks.
K6 Performance Monitoring

Monitoring K6 performance tests is essential to ensure that your tests are running as expected and to identify any potential issues. There are a number of different tools that can be used to monitor K6 performance tests, including:
- k6 cloud: k6 cloud is a cloud-based platform that provides a variety of features for monitoring K6 performance tests, including real-time monitoring, performance dashboards, and alerting.
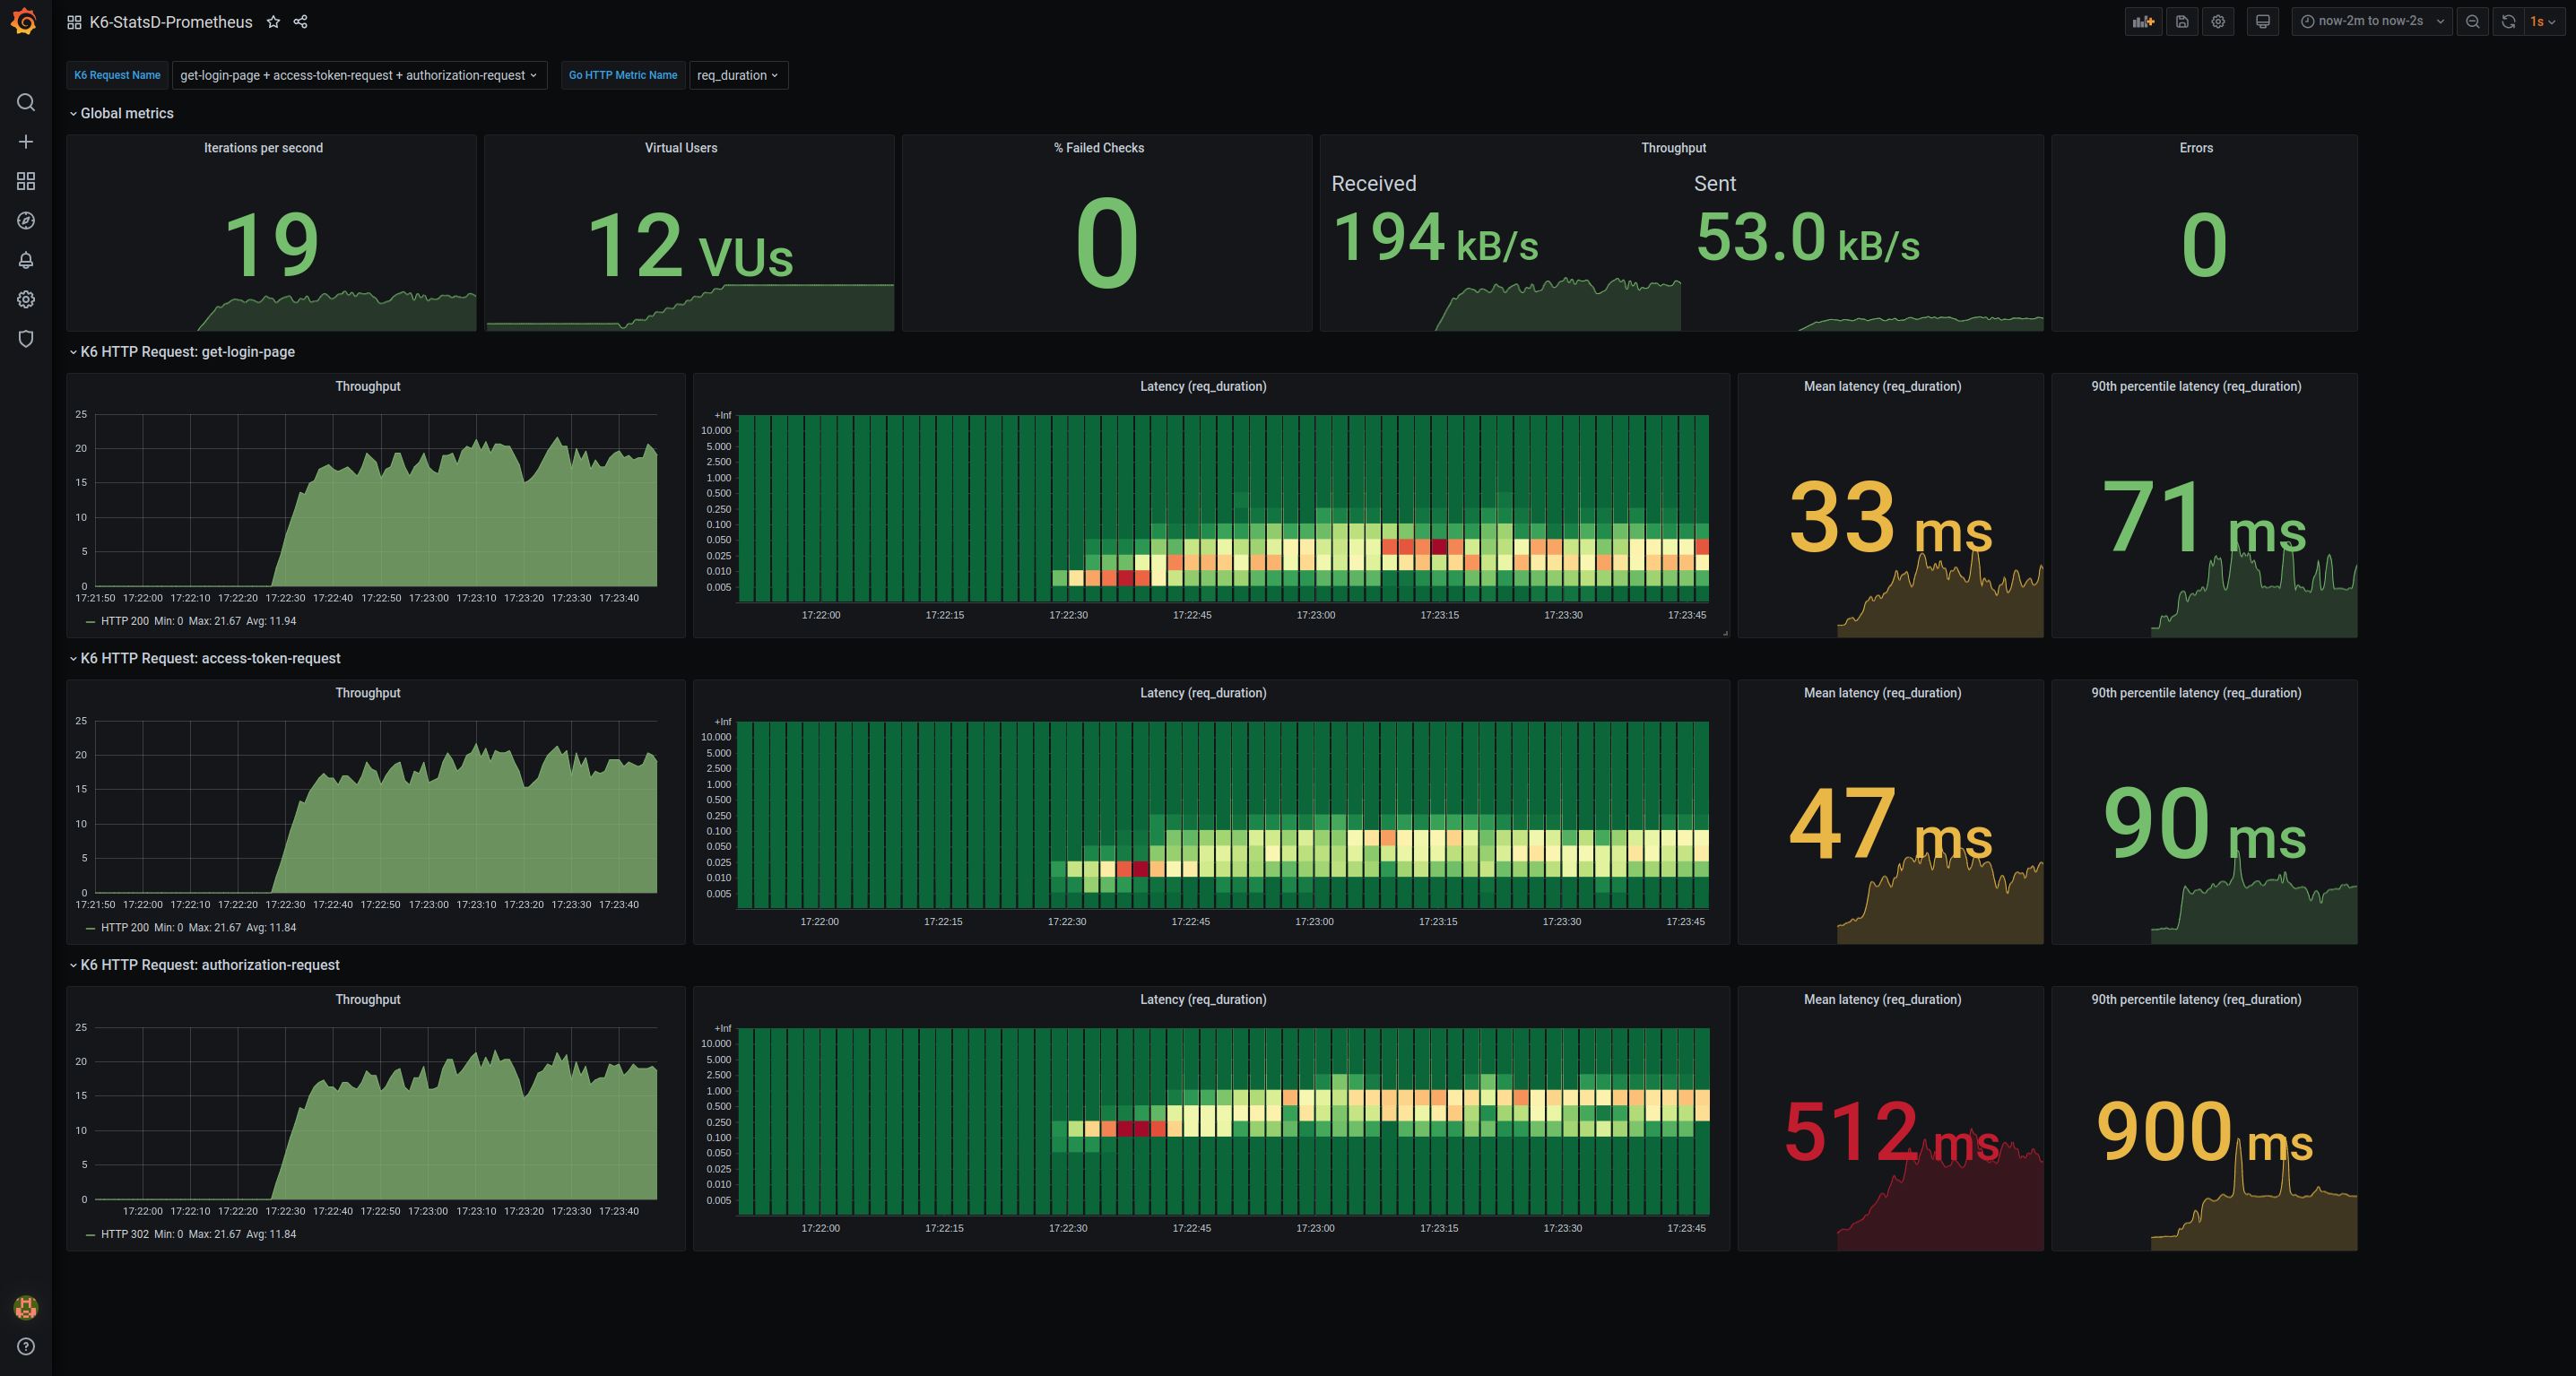
- Prometheus: Prometheus is an open-source monitoring system that can be used to collect and store metrics from K6 performance tests. Prometheus provides a variety of dashboards and alerts that can be used to visualize and track K6 performance metrics.
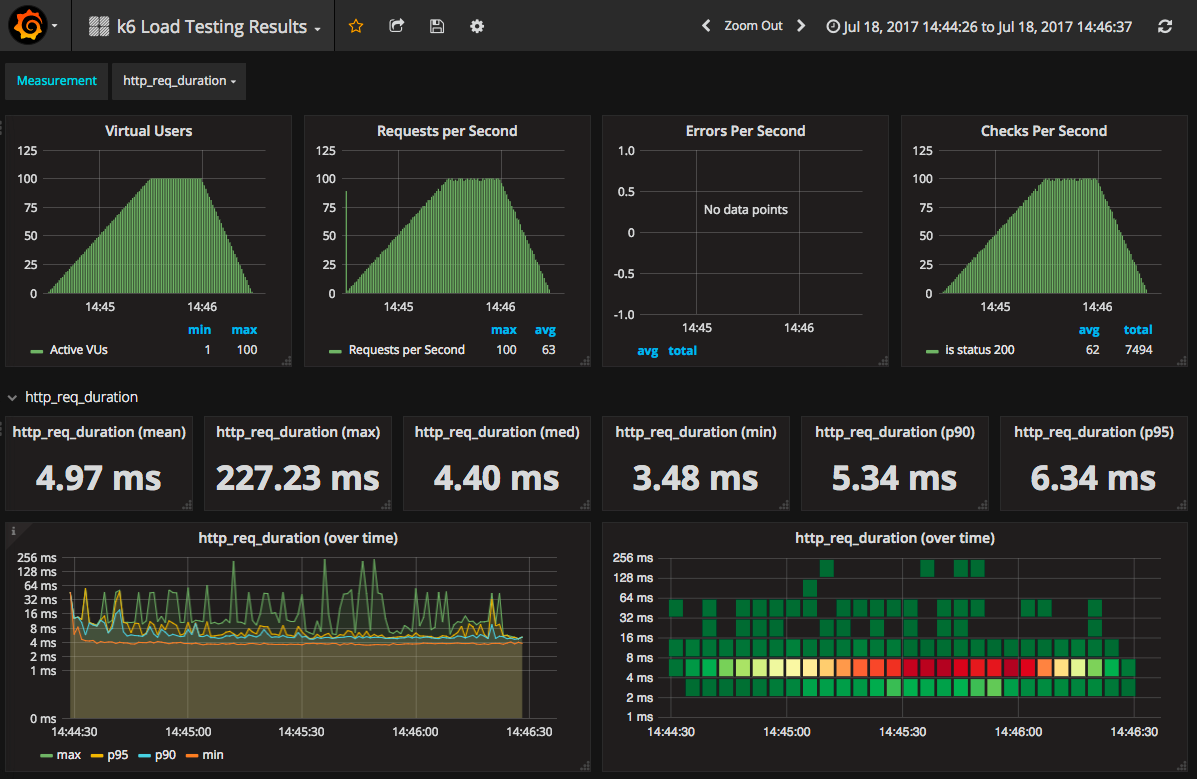
- Grafana: Grafana is an open-source visualization tool that can be used to create dashboards and visualizations for K6 performance metrics. Grafana can be used to create custom dashboards that track key performance metrics and identify trends over time.
These tools can be used to monitor a variety of key performance metrics, including:
- Response time: The amount of time it takes for a request to be processed by the server.
- Throughput: The number of requests that can be processed by the server per second.
- Error rate: The percentage of requests that result in an error.
- Resource usage: The amount of CPU, memory, and network resources that are being used by the server.
By monitoring these metrics, you can identify any potential performance issues and take steps to resolve them. For example, if you see that the response time is increasing, you may need to increase the number of servers that are handling the requests. Or, if you see that the error rate is increasing, you may need to fix a bug in your code.
Here are some best practices for monitoring K6 performance tests:
- Use a variety of monitoring tools: Using a variety of monitoring tools will give you a more complete view of your K6 performance tests.
- Set up alerts: Set up alerts to notify you when key performance metrics exceed certain thresholds.
- Monitor your tests regularly: Regularly monitor your K6 performance tests to identify any potential issues early on.
- Use performance testing best practices: Use performance testing best practices to ensure that your K6 performance tests are accurate and reliable.
K6 Performance Analysis

Analyzing the results of a K6 performance test is crucial for understanding the performance characteristics of the system under test and identifying areas for improvement.
There are several techniques that can be used to analyze K6 performance test results, each with its own strengths and weaknesses. The choice of technique depends on the specific goals of the analysis and the type of data collected during the test.
Data Visualization
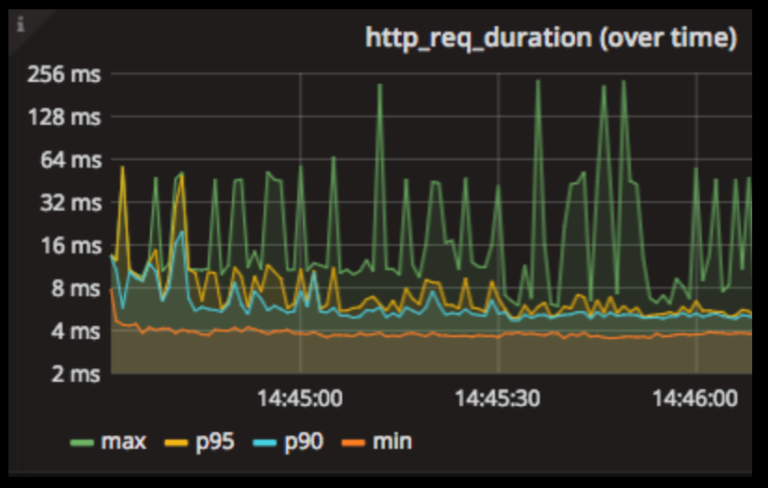
Data visualization techniques, such as graphs and charts, can be used to quickly identify trends and patterns in the performance data. This can help to identify areas of concern, such as bottlenecks or slowdowns, and to track the progress of performance improvements over time.
Statistical Analysis
Statistical analysis techniques, such as hypothesis testing and regression analysis, can be used to determine the statistical significance of the performance results and to identify the factors that are most influential on performance.
Code Profiling
Code profiling techniques, such as sampling and tracing, can be used to identify the specific parts of the code that are consuming the most time and resources. This information can be used to optimize the code and improve performance.
Explore the different advantages of Automation Test Case that can change the way you view this issue.
K6 Reporting and Visualization

K6 provides several options for creating reports and visualizations of performance test results. These reports and visualizations can be used to track progress, identify bottlenecks, and make informed decisions about how to improve the performance of your application.
Creating Reports and Visualizations
The easiest way to create reports and visualizations of K6 performance test results is to use the built-in reporting tool. This tool generates a variety of reports, including:
- Summary report: Provides a high-level overview of the test results.
- Detailed report: Provides a more detailed breakdown of the test results.
- Trend report: Shows how the performance of the application has changed over time.
To generate a report, simply run the following command:
k6 run --out report.html
This will generate a report in HTML format. You can open the report in a web browser to view the results.
Custom Reports and Visualizations
In addition to the built-in reporting tool, you can also create custom reports and visualizations using K6’s API. This gives you the flexibility to create reports that are tailored to your specific needs.
To create a custom report, you can use the following steps:
- Create a new JavaScript file.
- Import the K6 API.
- Write a function to generate the report.
- Run the report using the following command:
k6 run --out report.js
This will generate a report in JavaScript format. You can open the report in a text editor or use a JavaScript library to visualize the results.
Sharing Reports and Visualizations
Once you have created a report or visualization, you can share it with others by uploading it to a file-sharing service or by embedding it in a web page.
You can also use K6’s cloud service to share your reports and visualizations with others. The cloud service provides a secure and easy way to share your results with team members, clients, and stakeholders.
K6 Cloud
K6 Cloud is a fully managed cloud-based performance testing platform that simplifies and accelerates the load testing process. It provides a range of features and benefits that make it an ideal solution for organizations of all sizes.
Benefits of Using K6 Cloud, K6 for Performance Test
- Fully managed: No need to worry about infrastructure, maintenance, or updates.
- Scalable: Easily scale your tests to meet the demands of your application.
- Fast and reliable: K6 Cloud provides fast and reliable test execution.
- Easy to use: K6 Cloud has a user-friendly interface that makes it easy to set up and run tests.
li>Real-time monitoring: Monitor your tests in real-time and get instant insights into your application’s performance.
Features of K6 Cloud
K6 Cloud offers a comprehensive range of features that make it a powerful performance testing tool. These features include:
- Cloud-based test execution: Run your tests on K6’s global infrastructure.
- Real-time monitoring: Monitor your tests in real-time and get instant insights into your application’s performance.
- Powerful scripting language: Use K6’s powerful scripting language to create complex and realistic test scenarios.
- Comprehensive reporting: Get detailed reports on your test results that include performance metrics, graphs, and insights.
- Integration with CI/CD pipelines: Integrate K6 Cloud with your CI/CD pipelines to automate performance testing.
K6 Community
The K6 community is a vibrant and welcoming group of developers, performance engineers, and enthusiasts who are passionate about using K6 for performance testing. The community is very active and there are many ways to get involved.
One of the best ways to get involved with the K6 community is to join the K6 Slack workspace. The Slack workspace is a great place to ask questions, share ideas, and connect with other K6 users. You can also join the K6 Discord server, which is another great place to connect with the K6 community.
Contributing to the K6 Community
There are many ways to contribute to the K6 community. You can help by:
- Answering questions on the K6 Slack workspace or Discord server.
- Writing blog posts or articles about K6.
- Creating K6 scripts and sharing them with the community.
- Contributing to the K6 documentation.
- Translating K6 documentation into other languages.
K6 Resources

K6 offers a wealth of resources to help you get started and make the most of its capabilities. These resources include documentation, tutorials, and blog posts.
Documentation
The K6 documentation is a comprehensive guide to using K6. It covers everything from installation to scripting to performance analysis.
Tutorials
K6 offers a number of tutorials that can help you learn how to use K6. These tutorials cover a variety of topics, from basic scripting to advanced performance testing techniques.
Blog Posts
The K6 blog is a great resource for staying up-to-date on the latest K6 news and developments. The blog also includes a number of articles on performance testing best practices.
K6 Examples

K6 provides a comprehensive set of examples to help users test various types of applications and scenarios. These examples cover testing web applications, mobile applications, and APIs.
Testing Web Applications
K6 offers scripts for testing the performance of web applications, including load testing, functional testing, and API testing. Users can leverage these scripts to simulate real-world user behavior and assess the application’s response times, throughput, and error rates.
Testing Mobile Applications
K6 supports testing mobile applications by providing scripts for simulating user interactions, such as taps, swipes, and scrolling. These scripts enable users to evaluate the application’s performance under different network conditions and device configurations.
Testing APIs
K6 includes scripts for testing the performance of APIs. These scripts can be used to test the API’s response times, throughput, and error rates. Additionally, K6 allows users to create custom scripts to test specific API functionality.
Generating Performance Reports and Analyzing Test Results
K6 provides a comprehensive reporting system that generates detailed performance reports. These reports include metrics such as response times, throughput, and error rates. Users can analyze these reports to identify performance bottlenecks and optimize their applications.
K6 Best Practices: K6 For Performance Test
To get the most out of K6, it’s essential to follow best practices. These guidelines help you set up, configure, and run K6 tests effectively, ensuring reliable and accurate performance insights.
Check what professionals state about Postman Automation and its benefits for the industry.
Set Up and Configuration
- Choose the appropriate cloud provider for your testing needs, considering factors such as cost, performance, and availability.
- Configure your test environment carefully, including the number of virtual users, test duration, and target system settings.
- Use realistic test scenarios that reflect actual user behavior and system interactions.
Writing Efficient Scripts
- Write modular and reusable scripts to facilitate maintenance and scalability.
- Use the built-in K6 libraries and functions to streamline script development.
- Avoid unnecessary HTTP requests and optimize your scripts for performance.
Monitoring and Debugging
- Use K6’s built-in monitoring tools to track test progress and identify any issues.
- Set up custom metrics and alerts to monitor specific performance indicators.
- Utilize K6’s debugging capabilities to troubleshoot script errors and performance bottlenecks.
Different Environments
- Consider the target environment when setting up your K6 tests, including the operating system, network configuration, and resource availability.
- Use different environments for development, staging, and production testing to ensure consistency and reliability.
- Monitor and adjust your test configurations based on the specific requirements of each environment.
K6 Alternatives

K6 is a popular performance testing tool, but it is not the only option available. There are several other tools that can be used to test the performance of web applications. Each tool has its own strengths and weaknesses, so it is important to choose the right tool for the job.
In this section, we will discuss some of the alternatives to K6 and compare their features. We will also provide a brief summary highlighting the most suitable alternative to K6 based on specific use cases.
LoadRunner
LoadRunner is a commercial performance testing tool from Micro Focus. It is one of the most popular performance testing tools on the market and is used by many large organizations. LoadRunner is a powerful tool that can be used to test the performance of web applications, mobile applications, and APIs. It is also capable of simulating a wide range of user behaviors, making it a good choice for testing complex applications.
Pros:
* Powerful and feature-rich
* Can simulate a wide range of user behaviors
* Good support for mobile applications and APIs
Cons:
* Commercial software (paid)
* Can be complex to use
* May require additional plugins or licenses for advanced features
JMeter
JMeter is an open-source performance testing tool from the Apache Software Foundation. It is a popular choice for performance testing because it is free to use and has a large community of users and contributors. JMeter is a powerful tool that can be used to test the performance of web applications, mobile applications, and APIs. It is also capable of simulating a wide range of user behaviors, making it a good choice for testing complex applications.
Pros:
* Free and open source
* Large community of users and contributors
* Powerful and feature-rich
* Can simulate a wide range of user behaviors
Cons:
* Can be complex to use
* May require additional plugins or libraries for advanced features
WebLOAD
WebLOAD is a commercial performance testing tool from RadView Software. It is a powerful tool that can be used to test the performance of web applications, mobile applications, and APIs. WebLOAD is also capable of simulating a wide range of user behaviors, making it a good choice for testing complex applications.
Pros:
* Powerful and feature-rich
* Can simulate a wide range of user behaviors
* Good support for mobile applications and APIs
Cons:
* Commercial software (paid)
* Can be complex to use
* May require additional plugins or licenses for advanced features
Gatling
Gatling is an open-source performance testing tool from Exoscale. It is a powerful tool that can be used to test the performance of web applications, mobile applications, and APIs. Gatling is also capable of simulating a wide range of user behaviors, making it a good choice for testing complex applications.
Pros:
* Free and open source
* Powerful and feature-rich
* Can simulate a wide range of user behaviors
* Easy to use
Cons:
* May not be as well-supported as other tools
* May require additional plugins or libraries for advanced features
Comparison of K6 and Alternatives
The following table summarizes the key features and differences between K6 and other alternatives:
| Feature | K6 | LoadRunner | JMeter | WebLOAD | Gatling |
|—|—|—|—|—|—|
| Open source | Yes | No | Yes | No | Yes |
| Commercial | No | Yes | No | Yes | No |
| Free to use | Yes | No | Yes | No | Yes |
| Easy to use | Yes | No | No | No | Yes |
| Powerful | Yes | Yes | Yes | Yes | Yes |
| Feature-rich | Yes | Yes | Yes | Yes | Yes |
| Can simulate a wide range of user behaviors | Yes | Yes | Yes | Yes | Yes |
| Good support for mobile applications and APIs | Yes | Yes | Yes | Yes | Yes |
| Community support | Yes | Yes | Yes | Yes | Yes |
Summary
K6 is a great performance testing tool, but it is not the only option available. There are several other tools that can be used to test the performance of web applications, mobile applications, and APIs. The best tool for the job will depend on the specific requirements of the project.
If you are looking for a free and open-source tool, then JMeter or Gatling are good options. If you need a commercial tool with more features and support, then LoadRunner or WebLOAD are good choices.
Wrap-Up
In the realm of performance testing, K6 emerges as an indispensable tool, empowering you to identify performance bottlenecks, optimize resource utilization, and ensure seamless user experiences. Its intuitive scripting language, coupled with robust reporting capabilities, makes K6 an ideal choice for both novice and experienced testers alike.
As you embark on your performance testing journey with K6, remember that continuous optimization is key. Embrace the insights gained from each test, refine your strategies, and witness the transformative impact on your application’s performance. With K6 as your trusted companion, you hold the power to unlock the full potential of your systems and deliver exceptional user experiences.
Question & Answer Hub
What is the primary purpose of K6 for Performance Test?
K6 for Performance Test is designed to help developers and testers measure and analyze the performance of web applications, APIs, and other systems under various load conditions.
How does K6 differ from other performance testing tools?
K6 stands out with its open-source nature, ease of use, and ability to generate realistic load patterns that mimic real-world user behavior.
Can K6 be used for testing mobile applications?
Yes, K6 provides support for testing mobile applications through its ability to simulate mobile devices and network conditions.
What types of performance metrics can be measured using K6?
K6 enables the measurement of a wide range of performance metrics, including response times, throughput, error rates, and resource utilization.
How can I get started with K6 for Performance Test?
Getting started with K6 is straightforward. Visit the official website to download the tool and access comprehensive documentation and tutorials.

